kayadata
This package loads Kaya-identity data, synthesized from several sources.
To install the package from CRAN:
install.packages("kayadata")Once you’ve installed it, then you just need to use the command library(kayadata) to load the package.
Some of the functions the package provides are:
-
kaya_region_list(): Get a list of available countries and regions. -
get_kaya_data(): Get data for a specific country. Example:
mexico_data = get_kaya_data("Mexico")
mexico_data %>% filter(year >= 1965) %>%
  select(region:ef) %>%
  head()
#> # A tibble: 6 × 10
#>   region  year     P     G     E     F     g     e     f    ef
#>   <ord>  <int> <dbl> <dbl> <dbl> <dbl> <dbl> <dbl> <dbl> <dbl>
#> 1 Mexico  2023 0.128  1.33  8.01  490. 10.3   6.04  61.1  369.
#> 2 Mexico  2022 0.128  1.29  7.76  469. 10.1   6.04  60.5  365.
#> 3 Mexico  2021 0.127  1.24  7.42  443.  9.76  6.01  59.6  358.
#> 4 Mexico  2020 0.126  1.17  6.97  413.  9.28  5.96  59.3  354.
#> 5 Mexico  2019 0.125  1.28  7.65  481. 10.2   5.98  62.8  376.
#> 6 Mexico 2018 0.124 1.28 7.73 489. 10.3 6.03 63.3 381.-
project_top_down(): Project future population, GDP, energy use, and emissions. Example:
mexico_2050 = project_top_down("Mexico", 2050)
mexico_2050
#> # A tibble: 1 × 10
#>   region  year     P     G     g     E     F     e     f    ef
#>   <chr>  <dbl> <dbl> <dbl> <dbl> <dbl> <dbl> <dbl> <dbl> <dbl>
#> 1 Mexico 2050 0.154 2.51 16.3 10.9 609. 4.36 55.7 243.-
plot_kaya: Plot trends in Kaya variables for a given region or country. Example:
us_kaya = get_kaya_data("United States")
plot_kaya(us_kaya, "ef", y_lab = "Carbon intensity of economy",
          start_year = 2000, stop_year = 2010, log_scale = TRUE,
          trend_line = TRUE)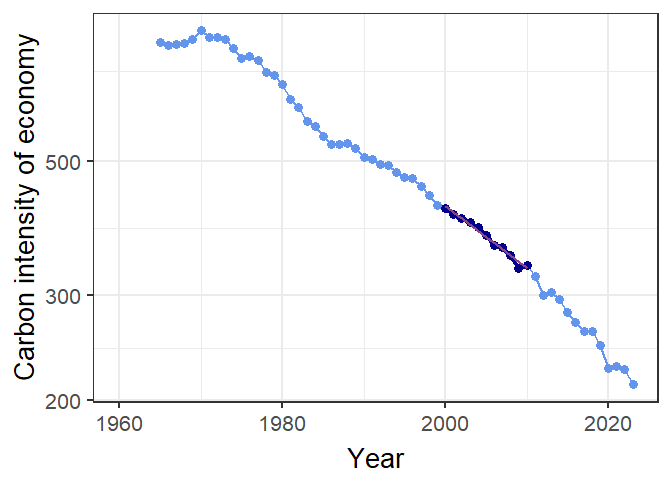
world_kaya = get_kaya_data("World")
plot_kaya(world_kaya, "P", start_year = 2000, stop_year = 2010, log_scale = FALSE,
trend_line = FALSE)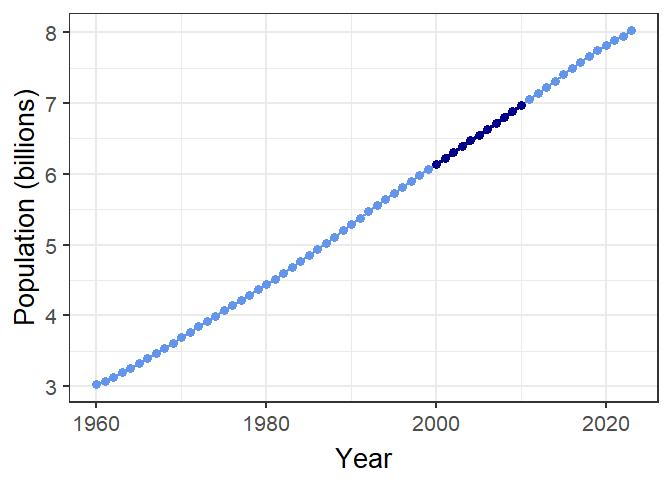 *
* get_fuel_mix: Get the fuel mix (coal, gas, oil, nuclear, and renewables) for a region or country. Example:
mexico_mix = get_fuel_mix("Mexico")
mexico_mix
#> # A tibble: 5 × 5
#>   region  year fuel        quads   frac
#>   <chr>  <int> <ord>       <dbl>  <dbl>
#> 1 Mexico  2023 Oil         3.64  0.454
#> 2 Mexico  2023 Natural Gas 3.33  0.416
#> 3 Mexico  2023 Coal        0.250 0.0312
#> 4 Mexico  2023 Nuclear     0.105 0.0131
#> 5 Mexico 2023 Renewables 0.690 0.0861-
plot_fuel_mix: Plot the fuel mix in a donut chart
plot_fuel_mix(mexico_mix)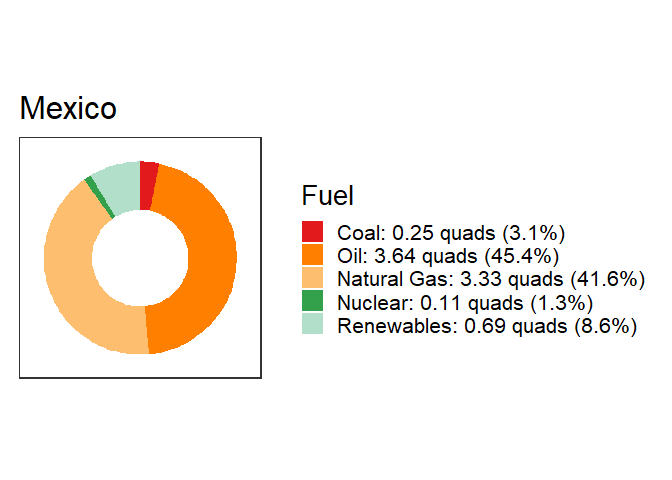
After you install the package, you can get more help inside RStudio by typing help(package="kayadata") in the R console window.
Code of conduct
Please note that this project is released with a Contributor Code of Conduct. By participating in this project you agree to abide by its terms.