Plot Kaya-identity variable
plot_kaya(
  data,
  variable,
  start_year = NA,
  stop_year = NA,
  y_lab = NULL,
  log_scale = FALSE,
  trend_line = FALSE,
  points = TRUE,
  font_size = 20,
  colors = NULL,
  pre_color = NULL,
  post_color = NULL,
  in_range_color = NULL,
  trend_color = NULL,
  line_sizes = NULL,
  pre_line_size = NULL,
  post_line_size = NULL,
  in_range_line_size = NULL,
  trend_line_size = NULL,
  point_sizes = NULL,
  pre_point_size = NULL,
  post_point_size = NULL,
  in_range_point_size = NULL
)
Arguments
- data
A tibble with Kaya-identity data or the name of a region or a region code.
- variable
The name of the variable to plot (character)
- start_year
The year to start highlighting the data (should correspond to the beginning of the trend calculation). Set to
NULLto turn off highlighting.- stop_year
The year to stop highlighting the data (should correspond to the beginning of the trend calculation). Set to
NULLto turn off highlighting.- y_lab
Optional label for the y-axis
- log_scale
Use log scale for y axis
- trend_line
Include a trend line
- points
Plot points in addition to the line.
- font_size
Base size of the font for axis labels and titles.
- colors
Named vector of colors to use for the plot. Elements should include
PRE,POST,IN-RANGE, andTREND, which respectively give the colors for the portion of the plot beforestart_year, afterstop_year, betweenstart_yearandstop_year, and the trend line.- pre_color
Override default color for the portion of the chart before
start_year.- post_color
Override default color for the portion of the chart after
stop_year.- in_range_color
Override default color for the portion of the chart between
start_yearandstop_year.- trend_color
Override default color for the trend line.
- line_sizes
Named vector of sizes to use for the lines in the plot. Elements should include
PRE,POST,IN-RANGE, andTREND, which respectively give the sizes for lines in the portion of the plot beforestart_year, afterstop_year, betweenstart_yearandstop_year, and the trend line.- pre_line_size
Override default line size for the portion of the chart before
start_year.- post_line_size
Override default line size for the portion of the chart after
stop_year.- in_range_line_size
Override default line size for the portion of the chart between
start_yearandstop_year.- trend_line_size
Override default size for the trend line.
- point_sizes
Named vector of sizes to use for the points in the plot. Elements should include
PRE,POST, andIN-RANGE, which respectively give the sizes for points in the portion of the plot beforestart_year, afterstop_year, and betweenstart_yearandstop_year.- pre_point_size
Override default point size for the portion of the chart before
start_year.- post_point_size
Override default point size for the portion of the chart after
stop_year.- in_range_point_size
Override default point size for the portion of the chart between
start_yearandstop_year.
Value
A plot object.
Examples
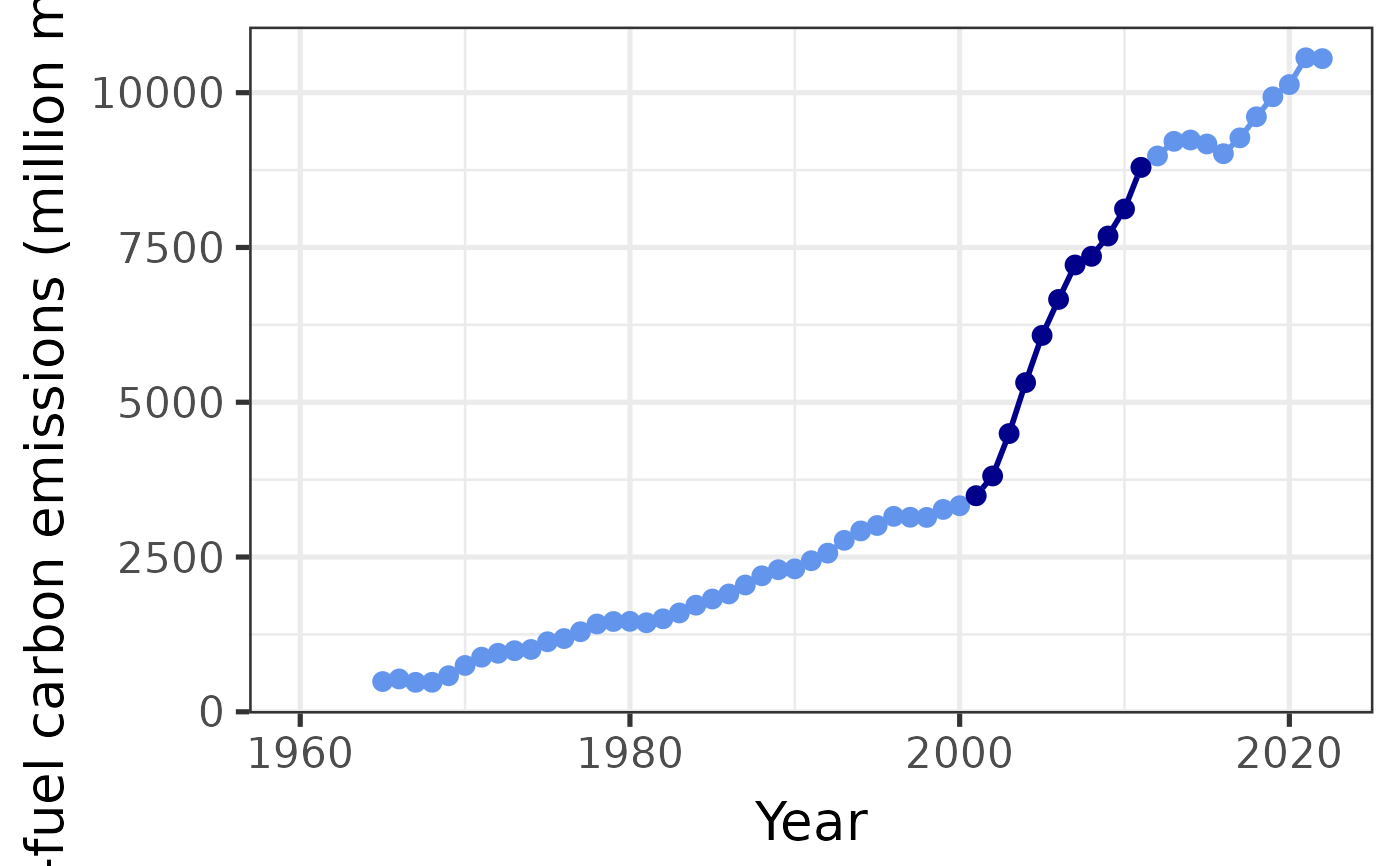
china <- get_kaya_data("China")
plot_kaya(china, "F", 2001, 2011)

if (FALSE) { # \dontrun{
uk <- get_kaya_data("United Kingdom")
plot_kaya(uk, "e", log_scale = TRUE, trend_line = TRUE)
plot_kaya(uk, "e", log_scale = TRUE, trend_line = TRUE,
          start_year = 1970, stop_year = 2000,
          colors = c(PRE="limegreen", POST="darkgreen",
                     "IN-RANGE" = "cadetblue", TREND="orange"),
          line_sizes = c(PRE=0.5, POST=0.5, "IN-RANGE"=1, TREND=1.5),
          point_sizes = c(PRE=2, POST=2, "IN-RANGE"=3))
plot_kaya(uk, "e", log_scale = TRUE, trend_line = TRUE,
          start_year = 1970, stop_year = 2000,
          pre_color = "limegreen", post_color = "limegreen",
          trend_color = "magenta",
          pre_line_size = 0.5, post_line_size = 0.5,
          trend_line_size = 1.5,
          pre_point_size = 2, post_point_size = 2, in_range_point_size = 3)
plot_kaya("United Kingdom")
plot_kaya("GBR")
} # }

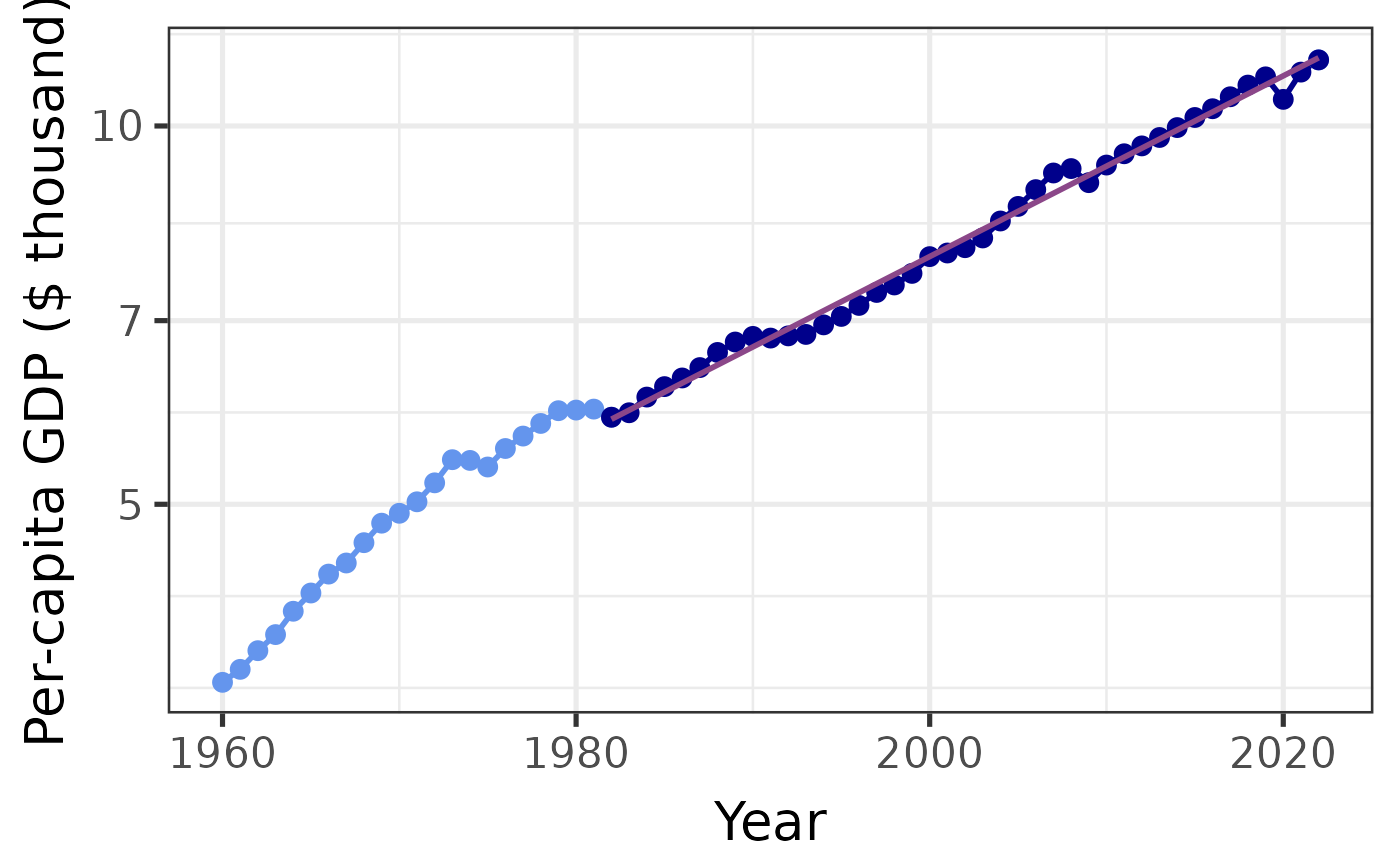
world <- get_kaya_data("World")
plot_kaya(world, "g", 1982, log_scale = TRUE, trend_line = TRUE)
